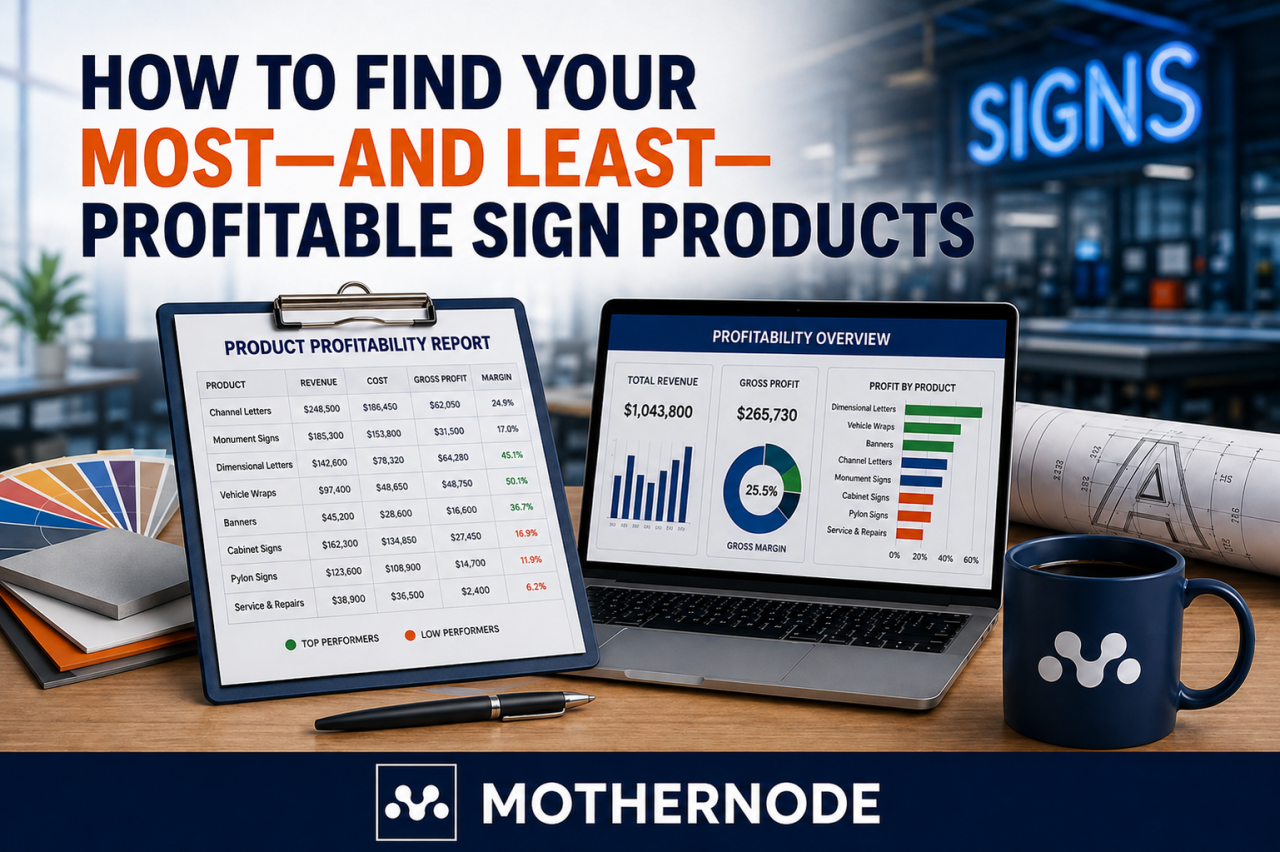
Revenue can tell you which sign products sell the most. It cannot necessarily tell you which ones make your company the most money.
A sign company may generate significant revenue from channel letters, monument signs, vehicle wraps, banners, dimensional lettering, or installation work while earning very different margins on each type of job. In some cases, the products generating the most revenue may actually be among the least profitable once labor, materials, equipment, subcontractors, rework, and overhead are considered.
That is why understanding profitability by product type is so important.
When sign companies know which products consistently generate strong margins—and which ones consume resources without producing enough profit—they can make better decisions about pricing, sales, production, purchasing, and even the types of customers they pursue.
The challenge is getting accurate enough information to see those differences.
Here is how sign companies can identify their most and least profitable products and use that information to improve the business.
Revenue and Profit Are Not the Same Thing
One of the easiest mistakes to make is assuming that your highest-selling products are automatically your most profitable.
Consider two hypothetical products.
Your company sells $500,000 worth of channel letters during the year and $250,000 worth of dimensional lettering.
At first glance, channel letters appear to be twice as valuable to the business.
But revenue only tells part of the story.
Channel letter projects may require aluminum, acrylic, LEDs, power supplies, fabrication, electrical work, permitting, installation equipment, engineering, and significant production labor.
Dimensional lettering might involve fewer components, shorter production times, and simpler installation.
If the channel letter projects produce a 20% gross margin while dimensional lettering produces a 45% gross margin, the difference becomes much more meaningful.
The goal is not simply to determine what you sell the most.
You need to understand what you make the most money selling.
Start With Accurate Job Costing
You cannot accurately determine product profitability without knowing what individual jobs actually cost.
That is where job costing becomes essential.
For every completed sign project, you should ideally be able to compare the selling price against the actual costs required to complete the job.
Those costs typically include:
- Materials
- Production labor
- Installation labor
- Subcontractor expenses
- Equipment costs
- Freight and shipping
- Permits
- Outsourced services
- Other direct project expenses
Suppose you sell a monument sign for $15,000.
Your estimated cost may have been $9,000, giving you an expected gross profit of $6,000.
But after the project is completed, you discover that the actual cost was $11,500.
Perhaps installation required an extra crew day. Maybe material prices were higher than expected. Perhaps fabrication took longer than anticipated.
The project generated only $3,500 in gross profit instead of $6,000.
Without comparing estimates against actual costs, you might continue selling similar projects using assumptions that are no longer accurate.
Over dozens or hundreds of jobs, those differences can dramatically affect profitability.
Categorize Your Sign Products
Once you have reliable job-costing information, organize completed projects into meaningful product categories.
The categories will depend on your business, but a commercial sign company might track products such as:
- Channel letters
- Monument signs
- Pylon signs
- Cabinet signs
- Dimensional lettering
- ADA signage
- Interior signage
- Banners
- Vehicle graphics
- Vehicle wraps
- Window graphics
- Wall graphics
- Wayfinding systems
- Digital displays
- Installation services
- Service and repair work
Avoid making categories so broad that they hide important differences.
For example, putting every project into a single category called “Signs” would not provide much insight.
At the same time, creating hundreds of highly specific categories may make the data difficult to analyze.
The objective is to create categories that allow you to compare similar types of work.
Measure Gross Profit by Product
Once projects are categorized, calculate the gross profit generated by each product type.
The basic formula is:
Revenue – Direct Costs = Gross Profit
For example:
Vehicle graphics generate $300,000 in annual revenue and $180,000 in direct costs.
Gross profit:
$300,000 – $180,000 = $120,000
Now compare that with monument signs.
Monument signs generate $500,000 in revenue but require $420,000 in direct costs.
Gross profit:
$500,000 – $420,000 = $80,000
The monument category produces significantly more revenue but less gross profit.
That alone can change how you think about the value of different product lines.
However, total gross profit is only one metric.
You also need to look at margin.
Calculate Gross Margin
Gross margin shows how efficiently each product converts revenue into profit.
The formula is:
Gross Profit ÷ Revenue × 100 = Gross Margin Percentage
Using the previous examples:
Vehicle graphics:
$120,000 ÷ $300,000 = 40% gross margin
Monument signs:
$80,000 ÷ $500,000 = 16% gross margin
That difference is significant.
For every dollar of vehicle graphics revenue, the company keeps approximately 40 cents in gross profit before overhead.
For every dollar of monument sign revenue, it keeps only about 16 cents.
This does not necessarily mean the company should stop selling monument signs.
It means management should investigate why the margin is lower.
Look Beyond Material Costs
Materials are easy to see because they usually come with invoices.
Labor can be much harder to evaluate.
That is especially important in the sign industry because labor requirements can vary dramatically between products.
Two projects using similar amounts of material might require very different amounts of design, fabrication, finishing, assembly, and installation time.
Consider a custom architectural sign that requires:
- Eight hours of design
- Four hours of project management
- Twenty hours of fabrication
- Six hours of painting
- Four hours of assembly
- Twelve hours of installation
If those hours are not accurately recorded against the job, the project may appear much more profitable than it really was.
Accurate time tracking allows you to understand the true labor requirements of different products.
You may discover that certain products repeatedly consume more production hours than your estimates assume.
That is often where hidden profitability problems begin.
Compare Estimated Costs With Actual Costs
One of the most valuable reports a sign company can review is estimated versus actual job cost.
When a project is quoted, assumptions are made about materials, labor, installation, equipment, and other expenses.
Once the job is complete, you can compare those assumptions against reality.
Look for patterns.
Do channel letter installations consistently take longer than estimated?
Do monument projects regularly exceed the expected fabrication hours?
Are vehicle wraps using more material than the estimating formula assumes?
Are certain outsourced components consistently more expensive than expected?
A single project exceeding its estimate may simply be an unusual situation.
But when the same product category repeatedly exceeds estimates, you may have a pricing or operational problem.
That information gives you an opportunity to correct the estimating process.
Watch for Rework
Rework can quietly destroy the profitability of a product.
A job might initially look successful until employees have to remake components, return to the installation site, reprint graphics, repaint surfaces, or correct measurements.
The additional costs may include:
- Replacement materials
- Additional production labor
- Additional installation labor
- Vehicle expenses
- Equipment rentals
- Shipping
- Rush charges
- Lost production capacity
If those expenses are not assigned to the original job, management may never realize how much the problem actually cost.
Tracking rework by product category can reveal important patterns.
For example, you may discover that a particular type of custom sign frequently requires installation adjustments.
The issue could involve surveying, design, engineering, fabrication tolerances, or communication between departments.
Fixing the process can improve profitability without increasing sales.
Consider Production Bottlenecks
Profitability is not only about margin percentage.
You should also consider how much capacity a product consumes.
Suppose Product A generates a 35% gross margin but requires extensive fabrication time on equipment that is already operating near capacity.
Product B generates a 30% margin but moves through production quickly.
Depending on volume, Product B may produce more profit per production hour.
This concept becomes particularly important when a company is busy.
Your production capacity is limited.
Every hour spent on one job is an hour that cannot be spent on another.
Analyzing profitability relative to production time can help you determine which products make the best use of your resources.
Analyze Installation Requirements
Installation is another area where product profitability can change quickly.
A project that looks profitable during fabrication may lose much of its margin in the field.
Common installation variables include:
- Crew size
- Travel time
- Fuel
- Crane or bucket truck requirements
- Equipment rentals
- Site accessibility
- Weather delays
- Customer scheduling delays
- Electrical requirements
- Unexpected site conditions
Tracking actual installation time and expenses by job allows you to identify products that routinely create installation overruns.
You may determine that the product itself is profitable but your installation pricing needs adjustment.
Examine Profitability by Customer
Product profitability becomes even more useful when combined with customer profitability.
The same product may generate very different margins depending on the customer.
For example, Customer A may order standard signs with clear specifications and predictable production requirements.
Customer B may order the same products but require multiple design revisions, rush production, special delivery arrangements, and frequent changes.
The selling price may look similar, but the true cost of servicing those customers can be very different.
Analyzing profitability by both product and customer can reveal where your strongest opportunities exist.
You might discover that a particular product is extremely profitable for one market segment but barely profitable for another.
Identify Your Profit Leaders
After analyzing enough completed jobs, certain product categories should begin to stand out.
Your strongest products often share characteristics such as:
- Reliable estimating
- Predictable material requirements
- Efficient production
- Low rework rates
- Strong pricing
- Repeatable processes
- Limited installation complications
- Consistent customer demand
These are your profit leaders.
They may deserve additional sales and marketing attention.
If dimensional lettering consistently generates strong margins and moves efficiently through production, for example, your sales team may want to pursue more projects involving dimensional signage.
Increasing revenue from your strongest product categories can improve overall profitability without requiring the company to dramatically increase total sales volume.
Identify Your Profit Drains
Your least profitable products deserve equally close attention.
Look for categories with:
- Low gross margins
- Frequent cost overruns
- Excessive labor requirements
- High rework rates
- Difficult installations
- Unpredictable material costs
- Heavy subcontractor dependence
- Frequent rush requirements
The immediate reaction should not necessarily be to eliminate those products.
Instead, determine why they are underperforming.
The problem may be pricing.
It may be estimating.
It may be purchasing.
It may be production efficiency.
It may be installation.
Or it may simply be that the product does not fit your company’s capabilities.
Once you understand the cause, you can decide what to do.
Raise Prices Where Necessary
Sometimes the simplest solution to an unprofitable product is better pricing.
If your historical data shows that a particular product consistently requires 15% more labor than your estimates assume, update your estimating formulas.
If material costs have increased, adjust pricing accordingly.
If installation routinely requires additional time, include that cost in future proposals.
Pricing should evolve based on actual operating data.
Companies that continue using old assumptions can gradually lose margin without realizing it.
Standardize What Works
Profitable products often become even more profitable when the company standardizes the process.
Look for opportunities to create:
- Standard material lists
- Production templates
- Installation checklists
- Preferred vendor lists
- Standard labor estimates
- Repeatable workflows
- Common design specifications
Standardization reduces variation.
Less variation usually means fewer mistakes, more accurate estimates, faster production, and more predictable margins.
Know When to Say No
Not every project is worth taking.
This can be difficult for growing sign companies because revenue feels valuable.
But a shop operating near capacity can actually hurt profitability by accepting low-margin work.
If certain products repeatedly consume excessive labor, create production bottlenecks, and generate poor margins, management should ask whether those projects deserve space in the schedule.
Sometimes the correct decision is to raise the price.
Sometimes it is to outsource part of the work.
And sometimes it is to stop offering the product altogether.
Saying no to the wrong work can create capacity for better work.
Review Product Profitability Regularly
Product profitability should not be analyzed once and forgotten.
Material prices change.
Labor costs change.
Equipment changes.
Vendors change.
Production processes improve.
Customer expectations change.
A product that was highly profitable two years ago may no longer perform the same way today.
Review profitability regularly—monthly, quarterly, or at another interval appropriate for your volume.
Look at both recent projects and longer-term trends.
The objective is to detect changes before they become major problems.
Better Business Systems Make Profitability Easier to See
The biggest obstacle for many sign companies is not understanding the importance of profitability.
It is gathering the information required to calculate it.
When estimating exists in one system, purchasing information in another, employee time on paper timesheets, production schedules on whiteboards, and accounting data somewhere else, determining the true profitability of a job becomes difficult.
Managers may spend hours collecting information from spreadsheets, invoices, time records, and accounting reports.
Even then, they may not have the complete picture.
An integrated business management system can connect more of that information throughout the lifecycle of a job.
Platforms such as Mothernode can help companies manage processes including CRM, estimating, sales orders, purchasing, inventory, production, job costing, time tracking, and reporting within a more connected environment.
Instead of waiting until the end of the year to determine whether the company made money, managers can gain greater visibility into how individual jobs and product categories are performing.
That visibility makes it easier to identify cost overruns, pricing problems, and operational inefficiencies while there is still time to address them.
Profitability Should Guide Growth
Growing a sign company is not simply about selling more.
It is about selling the right work at the right price while controlling the cost of delivering it.
A company can increase revenue significantly and still struggle financially if its fastest-growing products have weak margins.
Conversely, a business may be able to increase profitability substantially without dramatically increasing revenue simply by improving its product mix.
Understanding your most and least profitable sign products helps answer important strategic questions:
Which products should salespeople pursue?
Which estimates need to be adjusted?
Where should production improvements be made?
Which products deserve additional marketing?
Where are employees spending too much time?
Which products should potentially be outsourced?
And which types of work should the company consider walking away from?
Those decisions become much easier when they are supported by real job data.
Turn Job Data Into Better Decisions
Every completed sign project contains valuable information.
It tells you what customers are willing to pay, what materials actually cost, how long production really takes, how efficiently your team works, and how much profit ultimately remains.
The companies that capture and analyze that information can continually improve.
They can refine estimates based on actual results.
They can identify profitable niches.
They can correct inefficient processes.
They can negotiate better purchasing agreements.
They can improve production planning.
And they can focus their sales efforts on the work that contributes the most to the bottom line.
The goal is not necessarily to eliminate every low-margin product.
Some products may help win larger accounts, support important customer relationships, or lead to additional high-margin work.
The goal is to know the difference.
When you understand exactly which sign products make money—and which ones merely generate revenue—you can make smarter decisions about where your company should invest its time, people, equipment, and sales efforts.
For sign companies competing in an increasingly demanding market, that visibility can be one of the most valuable tools for building a healthier and more profitable business.